
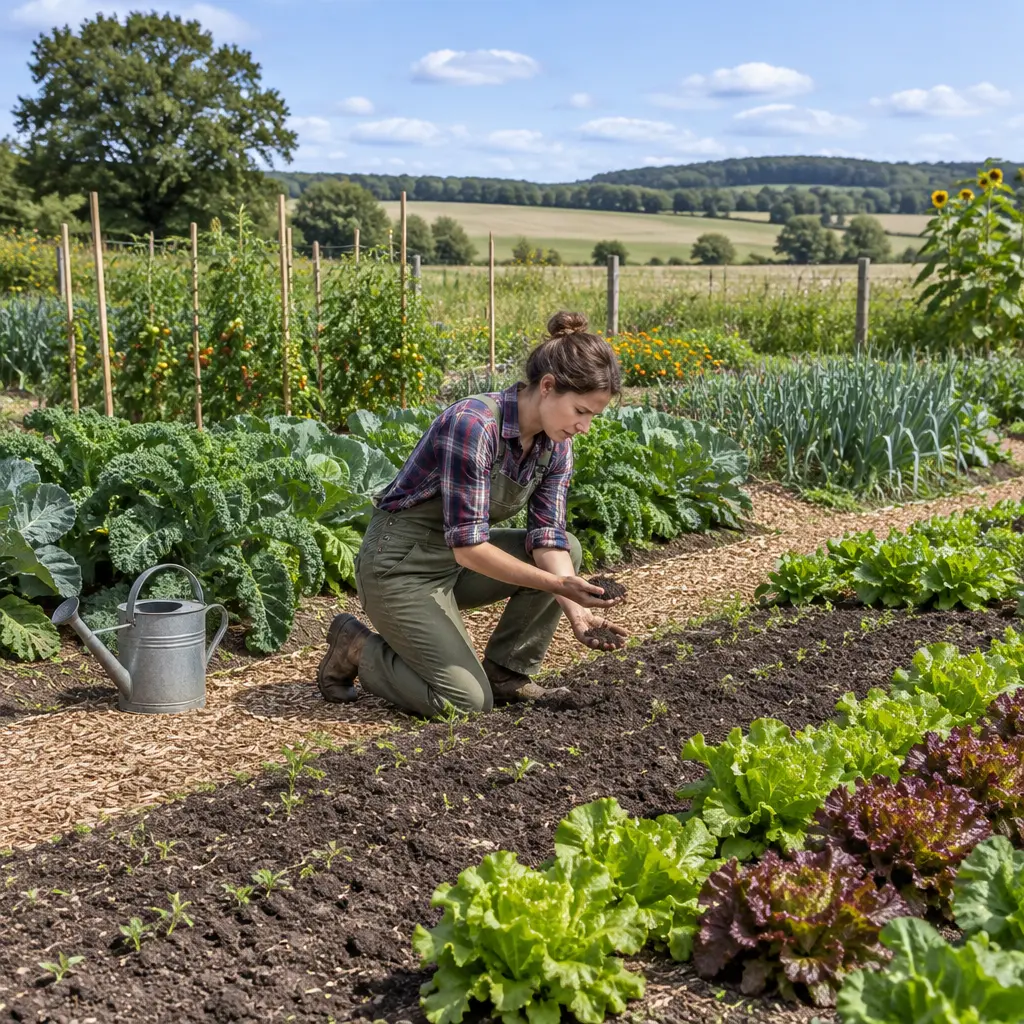
Soil health is the capacity of soil to function as a living system that sustains plants, animals, and people. You can assess many clues to that capacity without laboratory tests: how quickly water enters and drains, whether soil forms stable aggregates, how roots and earthworms move through it, and how much living cover and organic residue it supports. These field observations cannot replace laboratory measurements, but they can help you spot strengths, diagnose possible problems, and track changes over time. That matters because soil degradation can undermine food production and water quality; the United Nations’ Food and Agriculture Organization estimates that 33% of the world’s soils are moderately to highly degraded.
Field observations reveal soil health indicators
The U.S. Department of Agriculture’s Natural Resources Conservation Service (USDA NRCS) defines soil health as “the continued capacity of soil to function as a vital living ecosystem that sustains plants, animals, and humans.” It is not a single condition or score. Soil health reflects interacting physical, biological, and chemical processes, and a useful assessment compares several indicators rather than relying on one visual clue.
Without a laboratory, you can look for observable signs of water movement, soil structure, biological activity, and plant performance. These are best treated as screening indicators: a puddle, a compacted patch, or few visible earthworms may have several explanations. Compare similar locations and repeat observations under similar conditions to identify patterns.
Water infiltration and drainage
Infiltration is the movement of water from the soil surface into the soil. A simple comparison uses a bottomless can or ring pressed into the ground: pour in a measured amount of water and note how long it takes to soak in. Test several nearby spots, using the same ring size and water volume, and avoid comparing dry, cracked soil with saturated soil.
Fast or slow infiltration is not automatically good or bad. Very slow entry may point to surface sealing, compaction, or poor aggregation, while water that disappears rapidly may indicate coarse texture, cracks, or channels that do not necessarily store enough water for plants. The USDA NRCS identifies infiltration and water-holding capacity among useful soil-health indicators. Record the time, recent weather, and location so future tests are comparable.
Surface runoff, ponding, and erosion
Runoff is water that flows over the surface instead of entering the soil; ponding is water that remains on the surface after rain or irrigation. Look for rills, sediment deposits, exposed roots, crusts, and water collecting in low spots. These signs can suggest that rainfall is arriving faster than the soil can absorb it or that drainage is restricted.
Interpret the evidence in context: slope, soil texture, rainfall intensity, and blocked drains all affect water movement. A field with continuous plant cover may resist erosion better than bare soil, but a single storm is not enough to establish a long-term trend. Note where runoff begins and whether it carries soil into paths, ditches, or waterways.
Soil structure indicators show how soil holds together
Soil structure describes how individual particles are arranged into aggregates, or clumps, and the pores between them. NRCS guidance treats aggregate stability, compaction, and crusting as physical indicators because they influence air exchange, root growth, and water movement. Structure varies naturally with texture, so compare sites with similar soils and land use.
Aggregate stability and the simple slake test
An aggregate is a cluster of sand, silt, and clay particles held together by organic matter, roots, fungi, and other binding agents. For a basic slake test, place a dry, intact soil clod or aggregate in clear water and observe whether it remains together or rapidly breaks apart. Use similar-sized samples from different areas, and do not treat the result as a standardized laboratory measurement.
Aggregates that resist disintegration in water may indicate more stable structure, while rapid slaking can signal weaker aggregates. However, the result depends on soil moisture, texture, and how the sample was collected. NRCS describes aggregate stability as an indicator connected to resistance to erosion and the maintenance of pore spaces; the test is most informative when repeated across seasons and compared with management changes.
Compaction, crusting, and root restriction
Compaction occurs when soil particles are pressed closer together, reducing pore space. A shovel or garden fork can reveal dense layers, while a simple probe pushed into moist soil can help compare resistance between locations. Look for shallow or sideways-growing roots, stunted plants, wheel-track patterns, and water that ponds in compacted strips.
A hard surface crust can also obstruct seedling emergence and reduce water entry. Dry soil is naturally harder to probe than moist soil, and stones can create misleading resistance, so compare at similar moisture levels and check more than one point. Avoid working wet soil when possible: machinery and foot traffic on wet ground can intensify compaction.
Biological indicators make soil activity visible
Soil biology includes organisms such as earthworms, insects, fungi, bacteria, and plant roots. Many are too small to see without equipment, but their activity can be inferred from burrows, casts, decomposing residues, and root growth. These observations are indicators, not a complete census of the soil community.
Earthworms and visible soil fauna
Earthworms and other soil animals help mix organic material and create channels. To check for earthworms, dig a small, consistent block of soil when it is moist but not waterlogged, then count the worms and note casts or burrows. Repeat in several locations and at a similar time of year, because counts change with moisture, temperature, soil type, and season.
Finding earthworms can be an encouraging sign of suitable habitat, but their absence does not prove that soil is unhealthy. Some soils naturally support fewer earthworms, and certain species are non-native or can disrupt forest ecosystems. The USDA NRCS recommends observing biological activity as part of a broader assessment rather than using one organism as a universal score.
Residue breakdown, roots, and soil cover
Decomposition is the breakdown of dead plant material by soil organisms. Check whether crop residues, leaf litter, or mulch are slowly fragmenting and becoming incorporated into the soil. Also inspect roots: dense, well-distributed roots can indicate that plants are accessing soil volume, while abrupt changes in root direction or depth may point to barriers, dryness, or poor aeration.
Living plants and surface residues protect soil from raindrop impact, reduce temperature extremes, and provide food for soil organisms. The USDA NRCS lists soil cover among practical soil-health indicators. A garden, pasture, or field with persistent cover may be less exposed to erosion than bare ground, though cover needs vary by climate, crop, and season.
Plant performance and soil appearance provide supporting clues
Plant growth is a practical, integrated signal: roots respond to water, nutrients, oxygen, pests, and soil structure at once. Uneven growth, persistent wilting, yellowing, or poor establishment can therefore prompt a closer soil inspection. These symptoms are not soil diagnoses by themselves; weather, disease, pests, seed quality, and irrigation can produce similar patterns.
Color, smell, and texture
Soil color can reflect organic matter, mineral composition, moisture, and drainage history. Darker surface soil may contain more organic material, but color alone cannot quantify it. A pleasant earthy smell often accompanies active decomposition, while a sour or rotten-egg odor can occur in oxygen-poor, waterlogged conditions.
Texture is the relative proportion of sand, silt, and clay. A hand-texturing exercise—moistening a small sample and seeing whether it feels gritty, smooth, or sticky and whether it forms a ribbon—can provide a rough field estimate. It cannot reliably replace a laboratory texture analysis, but it helps explain why two soils differ in drainage and water retention.
Plant vigor and consistent comparisons
Compare plant height, canopy cover, rooting, and yield patterns across areas with similar crops and management. A persistent weak strip may correspond to traffic, drainage, or a soil-layer change; a vigorous patch may reflect better moisture or fertility. Map these patterns and revisit them rather than drawing conclusions from a single plant or season.
A simple field log can include date, recent rainfall, soil moisture, cover, infiltration time, clod behavior, probe resistance, earthworm observations, and plant condition. A chart with locations as rows and dates as columns can make trends easier to see. Use photographs from the same viewpoint to document surface cover, erosion, and crop growth.
Use field indicators as a screening tool, not a substitute for testing
Visual and hands-on checks are inexpensive and useful for identifying where to investigate or adjust management. They cannot reliably measure soil pH, nutrient concentrations, salinity, contaminants, or many biological properties. If plants show unexplained symptoms, if a specific nutrient recommendation is needed, or if contamination is possible, consult a qualified adviser and use an appropriate laboratory test.
For a practical assessment, choose several representative spots, avoid unusual conditions when possible, and repeat the same observations over time. Look for agreement among indicators: for example, slow infiltration alongside surface crusting and shallow roots is more informative than any one observation alone. Management practices such as maintaining living cover, reducing unnecessary disturbance, and limiting traffic on wet soil can then be evaluated against the field record.
Conclusion: combine soil health indicators for a clearer picture
Soil health is a soil’s continuing capacity to function, and no single no-lab observation can capture it. Infiltration and runoff show how water moves; aggregates, compaction, and crusting reveal aspects of physical structure; earthworms, decomposition, roots, and cover offer clues to biological activity; and plant performance provides a broader but nonspecific response.
Start with a few repeatable observations, record where and when you make them, and compare similar locations across seasons. Treat the results as clues, not definitive diagnoses, and seek laboratory analysis when a management decision depends on precise chemical or contaminant measurements. For further guidance, consult USDA NRCS soil-health resources and your local soil or agricultural extension service.
Sources: USDA Natural Resources Conservation Service, Soil Health, https://www.nrcs.usda.gov/conservation-basics/natural-resource-concerns/soil/soil-health; USDA Natural Resources Conservation Service, Soil Health Assessment, https://www.nrcs.usda.gov/conservation-basics/natural-resource-concerns/soil/soil-health/soil-health-assessment; Food and Agriculture Organization of the United Nations, Status of the World’s Soil Resources, https://www.fao.org/3/i5199e/i5199e.pdf